Phase Diagram of Carbon Dioxide (CO2)
A phase diagram is a plot of pressure versus temperature for the solid-liquid, liquid-gas, and solid-gas phase-transition equilibria of a substance. It indicates the physical states existing under specific pressure and temperature conditions. A phase diagram provides the pressure dependence of phase-transition temperatures like melting point, boiling point, and sublimation point [1,2].
The phase diagram of carbon dioxide (CO2) is shown below. It has a melting curve (BD), vaporization curve (BC), and sublimation curve (AB). Unlike water, the melting curve of carbon dioxide slopes towards the right. Point B is known as the triple point. It represents the pressure and temperature at which all three phases of a substance can coexist simultaneously. Point C is known as the critical point. It represents the maximum pressure and temperature beyond which the liquid and gaseous phases become indistinguishable. At such high temperatures, the gas cannot condense back to liquid, no matter how much pressure is applied. Beyond the critical point, the substance becomes a supercritical fluid [1-4].
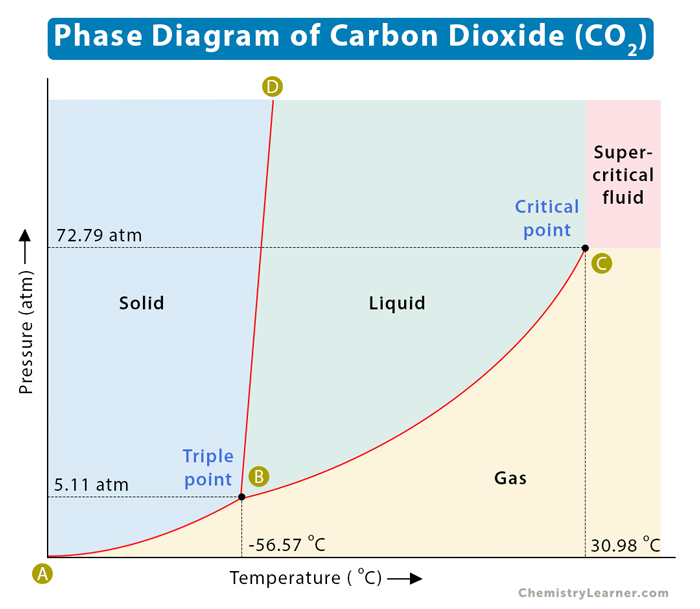
The triple point and the critical point of carbon dioxide are listed in the table below and shown in the image above. From the triple point, it is clear that liquid carbon dioxide cannot exist below a pressure of 5.11 atm. It means that at standard atmospheric pressure of 1 atm, solid carbon dioxide will sublime at -78 °C. For this reason, solid carbon dioxide is known as dry ice [1-3].
| Property | Temperature in Celsius (°C) | Temperature in Kelvin (K) | Pressure in atmosphere (atm) | Pressure in kilo Pascal (kPa) |
|---|---|---|---|---|
| Triple Point | -56.57 | 216.58 | 5.11 | 517.77 |
| Critical Point | 30.98 | 304.13 | 72.79 | 7375.45 |