Phase Diagram
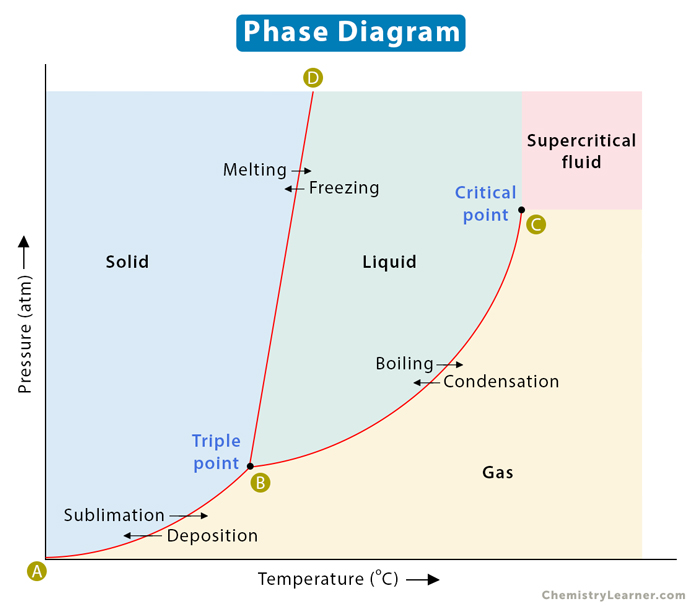
A phase diagram represents the various physical states or phases of matter at different pressures and temperatures. In other words, it summarizes the effect of pressure and temperature on the nature of a substance. A phase diagram is divided into three areas representing the substances’ solid, liquid, and gaseous phases[1-4].
Several distinct lines separate these phases. These lines are called lines of equilibrium or phase boundaries and represent the equilibrium between the phases. A point on these lines indicates that multiple phases can coexist in thermodynamic equilibrium. Phase transitions occur along these lines.
A representative phase diagram of a pure substance is shown below.
How to Read a Phase Diagram
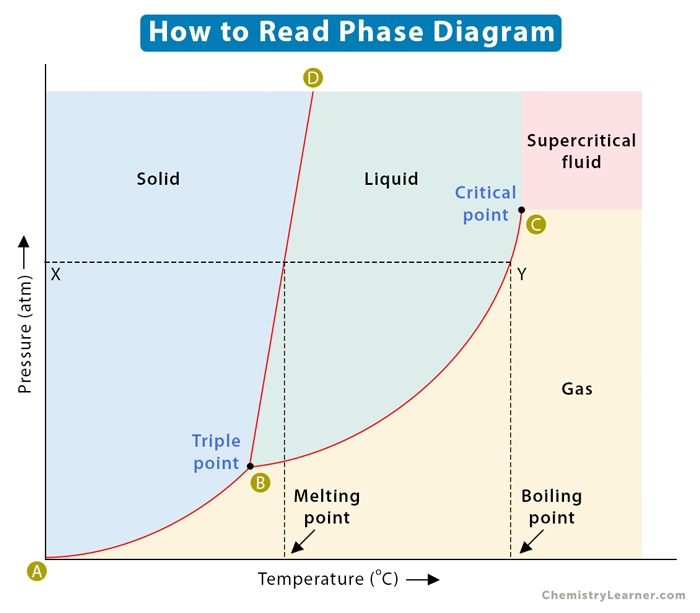
A two-dimensional phase diagram shows temperature along the horizontal axis and pressure along the vertical axis. The pressure is plotted in the unit of atmosphere (atm) or Pascal (Pa), and the temperature is in Kelvin (K) or degrees Celcius ( oC). The lines of equilibrium represent a pressure-temperature combination where two phases can coexist in equilibrium. Low temperature and high pressure favor solid formation, and high temperature and low pressure favor gas formation. Liquid lies in between these two regions [1-6].
Consider the horizontal dashed line XY as shown in the image below. As we move across the diagram from left to right, we pass through all three phases of matter. We start with the solid phase, cross the solid-liquid line (BD), and move into the liquid phase. We continue along the dashed line, cross the liquid-vapor line (BC), and finally reach the gaseous phase. In summary, if we increase the temperature of a substance at constant pressure, the substance transforms from solid to liquid to gas.
Along any line, two phases are in equilibrium with one another. It means that the rate at which a substance transforms from one phase to another is the same as when it transforms back to the first phase. Let us now analyze these phase boundaries.
AB line
Consider line AB, where the solid phase is in equilibrium with its gaseous counterpart. Every point on this line represents the condition under which the solid is in equilibrium with the gas. In other words, the rate at which the solid transforms into gas is the same as when the gas transforms back into solid.
BC line
The BC line contains all the conditions of pressure and temperature at which the liquid boils. Here, the liquid is in equilibrium with the gas. In other words, the boiling rate is equal to the condensation rate.
BD line
The BD line represents the equilibrium between solid and liquid. Each point on this line depicts the condition under which a solid melts into a liquid. The reverse also holds. The rate of melting is equal to the rate of freezing. The BD line is normally vertical for most pure substances because the melting point is not much affected by a change in pressure. For most compounds, the slope is slightly positive. It is slightly negative for water because ice melts upon applying pressure.
Triple Point and Critical Point
The phase diagram has two essential points – triple point and critical point. The point where the lines intersect is called the triple point. It is the pressure and temperature conditions at which all three phases, solid, liquid, and gas, coexist in equilibrium.
The critical point is the highest temperature and pressure at which a gas and a liquid can coexist at equilibrium. The critical point terminates the liquid-gas line and establishes the critical pressure and temperature. Beyond this point, the two phases become indistinguishable and form a phase known as a supercritical fluid. In the image above, point B is the triple point, and point C is the critical point. The supercritical fluid phase is indicated distinctly.
Phase Diagram Example
A well-known example of a phase diagram is that of water, as shown below. We know that water exists as ice, liquid water, and water vapor or steam. Water has a triple point corresponding to the temperature and pressure at which ice, liquid water, and vapor coexist in a stable equilibrium. It also has a critical point. It is that point at which water vapor cannot be forced back into water, no matter how much pressure is applied. Another example of a phase diagram is that of carbon dioxide, which is discussed in this article [1-6].
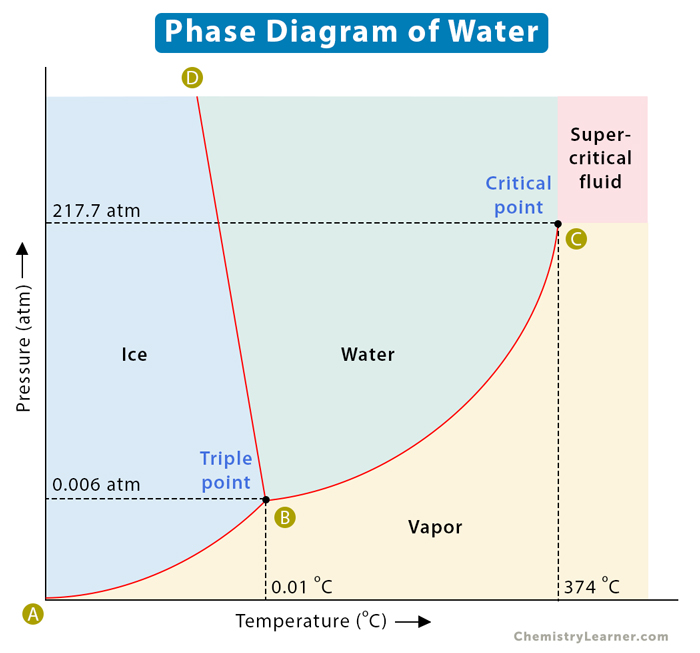
The following table lists their values.
| Property | Temperature in Kelvin (K) | Temperature in Celsius (°C) | Pressure in kilo Pascal (kPa) | Pressure in atmosphere (atm) |
|---|---|---|---|---|
| Triple Point | 273.16 | 0.01 | 0.608 | 0.006 |
| Critical Point | 647.14 | 373.99 | 22063.519 | 217.7 |